 (CoVid19 update) -- this is a prologue to an article written in 2009, but that (unfortunately) it is again perfectly suited for the occasion. Internally or externally triggered economic dynamic changes create business cycles (7 - 10 years in developed countries, with higher cadence in developing economies). The financial market's crisis of 2009 wiped out not just a large amount of economic value and trading off the markets -- also a good number of companies, large and small. The new crisis in 2019 - that of the CoVid-SARS-19, due to the extended (almost 6 months by now) blocking of the trade due to countries' lock down- , has already impacted the economy. Massive total or temporary lay-offs, decrease by 10% - 15% of the countries' GDP and PPP recession for the population have been already calculated by the macroeconomists. Obviously tele-work, webminars, ane digitalization seem to have taken over and diffused part of the impact - but...really? On the classical business models - all those who live on manufacturing, retail, or services that cannot be served digitally, the same question than 10 years ago is posed -- will this be an V, W or L crisis....? Whichever the outcome is, readiness is a must....
The effect of sustained financial crisis on large & small company’s portfolio management
The financial markets crash of 2009 was announced to be very profound necessarily to last very long. The large private & national banks, the ratin agencies, investment agencies, large companies and pension plans – the ones that provided the pulse and the vision for market developments, and were the drivers behind them, were also the crisis drivers. This resulted in the deep erosion of their moral authority, and their credibility to predict (or impact) the future. Since then, only some international agencies (the IMF, the World Bank, and alike) make sound prognosis. These prognosis might be sound, but after several announcements of ‘green sprouts’ on the economy, that were mirages, cannot be trusted anymore either.
The crisis has had a rippled massive effect in all the developed, debt-ridden economies, which, in turn –and with several months of lag, has collapsed the developing countries also --as most of them rely on exports to the big countries, which have frozen their internal markets. After almost 2 years, and some shock waves (Iceland, Ireland, Greece, Russia), the question is if this crisis is going to be “U shaped, “W” shaped or just a plain “L” – and nobody seem to be able to bet on any of the outcomes..
How have companies reacted to the change versus the previous 10 years of economic bonanza and upper single (or double) digits growth? A good bunch of them did not have time to react, and, heavily in debt due to large expansion undertaken during the bull market times, they went bankrupt – technically, or for real, with product close-ups, delisting, or brand sales at a fraction of the intangible value, diminished due to the debt burden.
The acid test endured by these out companies should have been considered as omen for the ones still on business. Nevertheless, most of the middle size companies saw the quick fall of competition as a blessing in hard times, more than an example of what would happen to businesses with no strict financial control.
Companies started fostering measures of financial control that are usually relaxed during the waves of high revenue; cash management (delaying payments and shortening credit lines), checking on the real effectiveness of their teams, downsizing and minimizing expendable cost, as well as establishing unpopular measures of travel and expenses. These are quickly implementable measurements that are all well-established ‘crisis control’ elements – but most of the firms do not look at the source of the income critically. Or, at least, they don’t look at them, until it is too late.
The portfolio of most of the companies is composed of – as BCG’s matrix would go- four different types of products. There will be some stars, products based on innovation or recent launches. The company will have a stronghold of cash cows –the backbone of the company- there will be also a few dogs, also known as “strategic products”, and some questions marks. Why is there space for dogs and questions marks? Dogs are products that do not give money but are to be supported due to other reasons -we will explain what “other” means later. Question marks are products that should, could or must be offloaded… at some point, and didn’t do so because of different reasons. These “dogs” and “Question marks” are a burden, but still viable to be maintained in good times… but why do they exist still in not good times? Yet, that is a question that it is not often being posed.
Portfolios quickly transform, as much due efforts that the company put behind, as competitive activity, or market changes. In the case of a sudden and deep crisis, your last year’s portfolio segmentation is obsolete. There is no doubt about it. Why? Market swings, price dumps, competitor’s going out of the market, purchase power of your customers, re adjustments of basic needs… all these events will impact the strategic position of your product in the market, together with its topline force a reclassification of your products.
Once that your products are re-segmented, and you can isolate your tactical back-bones (i.e. the products, which, under the current conditions, continue making stable sales), you will need to start setting apart the black sheep. Black sheep are products that, apparently, are making money for you, but, once analysed, only render negative return on investment, because your resources behind are too expensive, or because their margin is very reduced. Being sunk in a crisis of, the depth and length of the current one, there is no space for non-performing products. And non- performing products have to go. The sooner, the better. They should go, at least, of the M&S investments booked for them. These non-performing products, usually called “strategic”, which are imposed by HQ due to branding reasons, or because of price transfer interests, are eroding the cash base of the local company, day after day, and weakening the capacity of response due to more and more restricted financial basis that handcuffs operations on any additional investment manoeuvre.
The table below presents a real example analysis to a morphing portfolio. This is hard look at a morphing portfolio a share of a hard time due to the crisis portfolios are usually defined as portfolios of companies choosing to move from main-stream products to specialized/ or vice versa. This table is a classical, measuring growth and MS, in the previously described matrix.
This company has 8 products with a (at first glance) well balanced product portfolio. But...what happens if we start looking in more detail to the financial dynamics of each one of the products?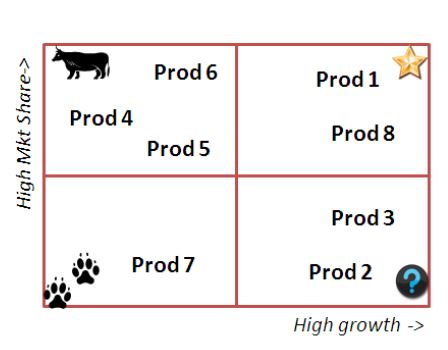
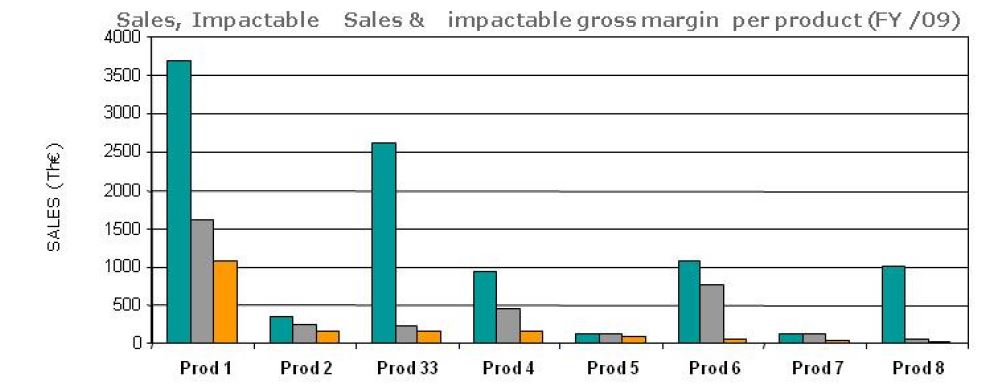
The graph below represents various financial indicators for the 8 products of the portfolio of this company. The blue column represents the absolute sales of each one of the products. At first glance, this company has a balanced portfolio – two products are the backbone of sales (prod 1 & 3), another three products (4, 7, 8) diversify the risk, and then there are the ineffable dogs –or question marks, which in a crisis period, can be assimilated to dogs products 2, 5 and 7.
Until here, everything seems normal. Now, if we move one step deeper, we can calculate the “impactable sales”, i.e. the sales of each one of the products above carryover. These are the sales due to the investment (in Marketing and Sales) that you have made in the last year. Any year’s sales of a product are composed of the carryover – i.e. the percentage of sales due to the brand equity, and due to the previous year investments, and the sales due to the yearly sales effort. The carryover effect is relatively easy to understand, if you personalized it – when to the supermarket, there are a good bunch of products that you buy mechanically - becaus eyou have been already using the product or the brand for years. These are carryover sales. If you get attracted to buy a product because there is a special promotion, bundle, 2x1, coupon reduction, demo in store, or someone came to tell you how good this product is , those are impactable sales.
If you look now at the grey columns on the graph, these are the year’s impactable sales for the products in this company’s portfolio. As you can see, products 1, 4 and 6 have a fair or lion share of impactable sales – that is they respond to promotion. The others...well, not so much.
Now, which is your investment on each one of these products, and how does it transfer impactable sales? Answering that provide you with real RoI.
There is one more column to look at with attention; that is the orange one, which depicts the impactable profit margin. You might have strategic products in your portfolio that apparently make many sales, and it could be that, after the calculation of impactable sales, they actually make many sales. But then,.... your margin on that product is very small, either because there is a price transfer to HQ (the infamous strategic products mentioned before), or because your manufacturing or shipping costs are running to high, and some optimization is to be made on this respect.
The portfolio of the company, after this looks slightly different, as you can see in the comparative tables here below. In crisis times, it is not the best moment to look at market dynamics, but at your own financial ones. By segmenting the portfolio through these alternative dimensions (product responsiveness to investment, and product margin), you will assure that, on dire straits, you are putting the money where it is worth every penny – to salvage as much as you can, where others perish.
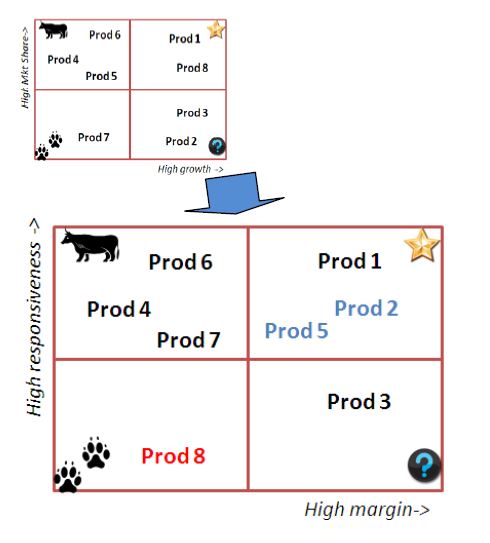
You could run this exercise in a relatively easy manner –let us know if you need help. With the results at hand, it might be that your company is making the right decisions...but you should have the certainty that you know that as a fact.
And, if you see that your portfolio has changed, and the products’ investment might not be optimized, then it is time to rethink your sustainability strategy.
For further information on management, investment, products, or marketing mix optimization, contact us